Visualizing Agricultural commodities in karnataka
top commodities in different districts of karnataka viusalized 🌾
Based on Karnataka Agriculture market data (data.gov.in, 2013), let us briefly explore the agricultural commodities across various districts in Karnataka through visualization.
If you are interested in the how this visualization was created, checkout this post- Python's folium to create choropleth maps
Note that ‘Arrival’ refers to the arrival of commodities at a place for sale, from various sources such as villages, storages, etc.
The purpose of this post is to explore :
- What are the top 10 commodities in Karnataka?
- What is the largest agricultural arrival commodity for each district?
- For each of the top commodities which districts produce them in large quantities?
How to view the maps in this post?
- Click on the image to open interactive map
- hover over it for district name
- Click on the icon to get commodity name (last map)
- toggle between different crop options, to get the distribution
Top ten Agricultural commodities in Karnataka
Paddy and maize are top agricultural commodities, followed by onion, rice, potato, cotton, green ginger, tomato, areca nut, and tur.
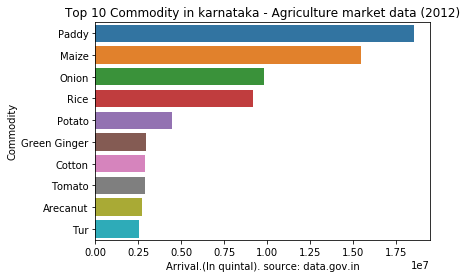 Fig.1: Top ten Commodities in karnataka(arrival values)
The commonality between this result and the national share (see disclaimer below) is areca nut, proving its significance in Karnataka. It is predominantly found in Udupi, Shimoga, Dakshina, and Uttara Kannada.
Although due to its harmful effects on health (it is considered as a carcinogen), it is prohibited for sale in countries like Australia and Newzealand, and banned in UAE.
Largest agricultural commodity for each district
- Exploring the largest commodity in each district, we find that paddy and maize dominate the list (see map below). With paddy being the highest commodity in Raichur, Bellary, koppal, Uttara Kannada, Chikmagalur, Mysore and chamrajanagar.
- Whereas Maize is a top crop in Bagalakot, Gadag, Haveri, Davanagere, Shimoga, Chitradurga, Chickballapur and Bangalore rural.
![]() Fig 2: Largest commodities in each district. Click on the image for the interactive map. Icons made by Freepik from www.flaticon.com
Fig 2: Largest commodities in each district. Click on the image for the interactive map. Icons made by Freepik from www.flaticon.com
- The top commodities in Udupi and Dakshina Kannada are arecanut, in Hassan and Kodagu it is Green ginger, in Gulbarga and Bidar its tur. in Bijapur it is cotton.
- Mango is the top arrival commodity in Ramnagar, jaggery in Mandya, tomato in Kolar and copra in Tumkur.
- Onion is a top commodity in Belgaum, Dharwad and Bangalore Urban.
Major Districts where the top commodities arrive.
Here are some of the commodities market share by the district.
- Paddy As we can see the majority of paddy comes from Raichur,koppal, and davanagere.In fact, Raichur accounts for a 20.28% share of overall paddy in Karnataka.
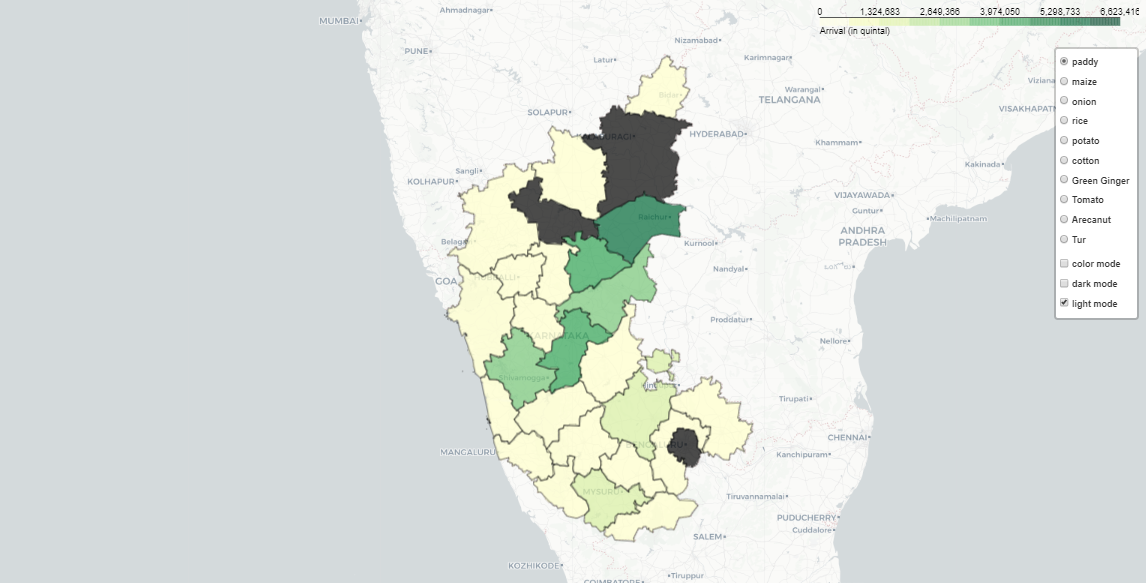 Fig 3: Paddy across karnataka(click on the map for interaction)
Maize
Shimoga, Davanagere, and Haveri account for 63.25% of maize in Karnataka.
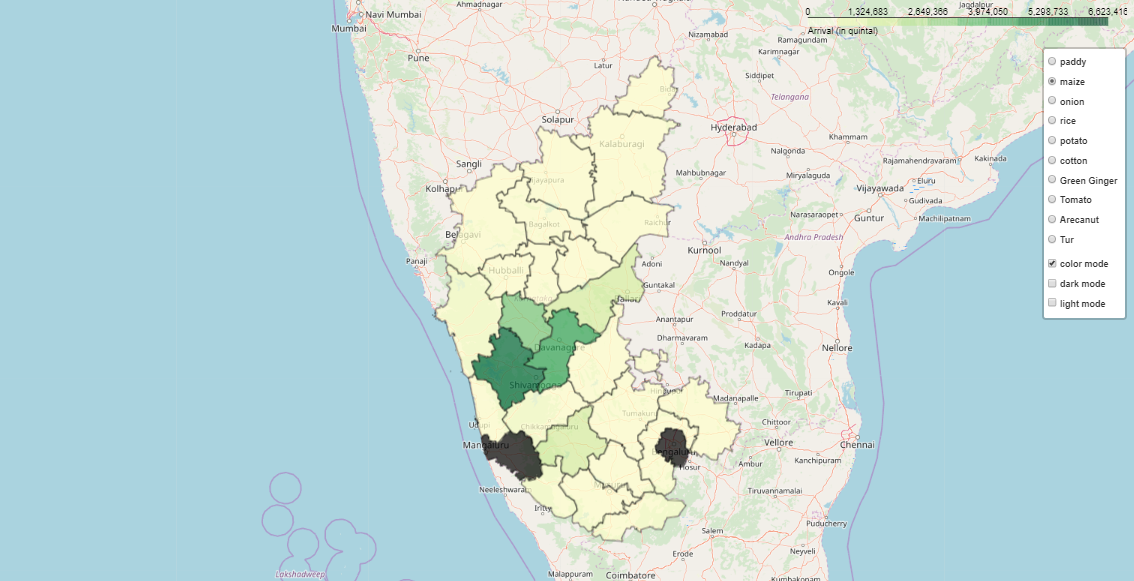 Fig 4: Maize across karnataka(click on the map for interaction)
Tomato
Kolar accounts for 51.95 % of tomato in Karnataka.
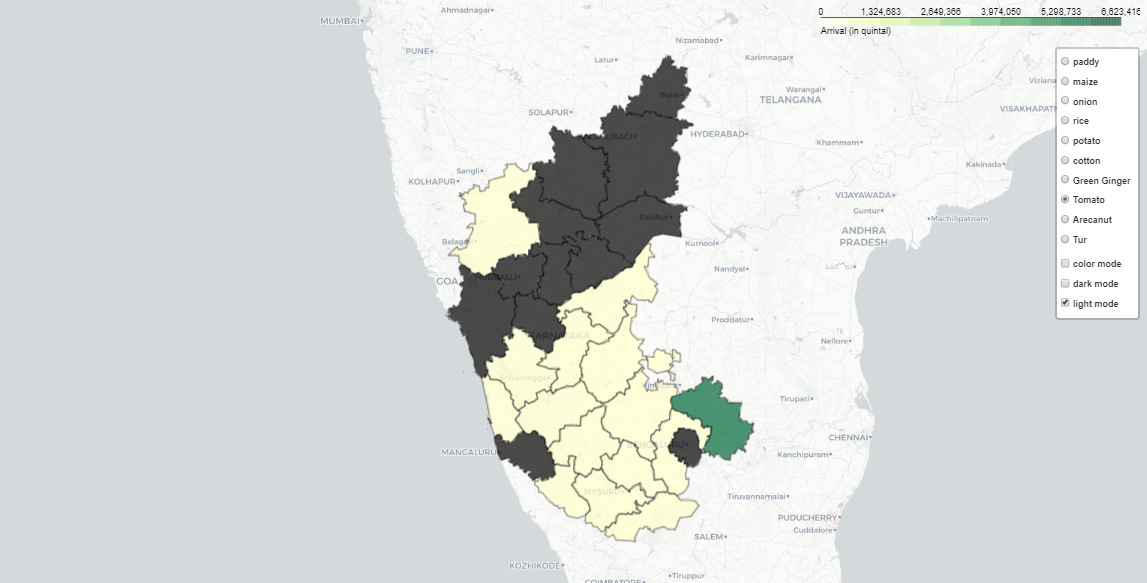 Fig 5: Tomato across karnataka(click on the map for interaction)
Arecanut
Udupi, Shimoga, Uttara Kannada and Dakshina Kannada account for 85.75% of Arecanut, With Udupi alone having 33.41% market share.
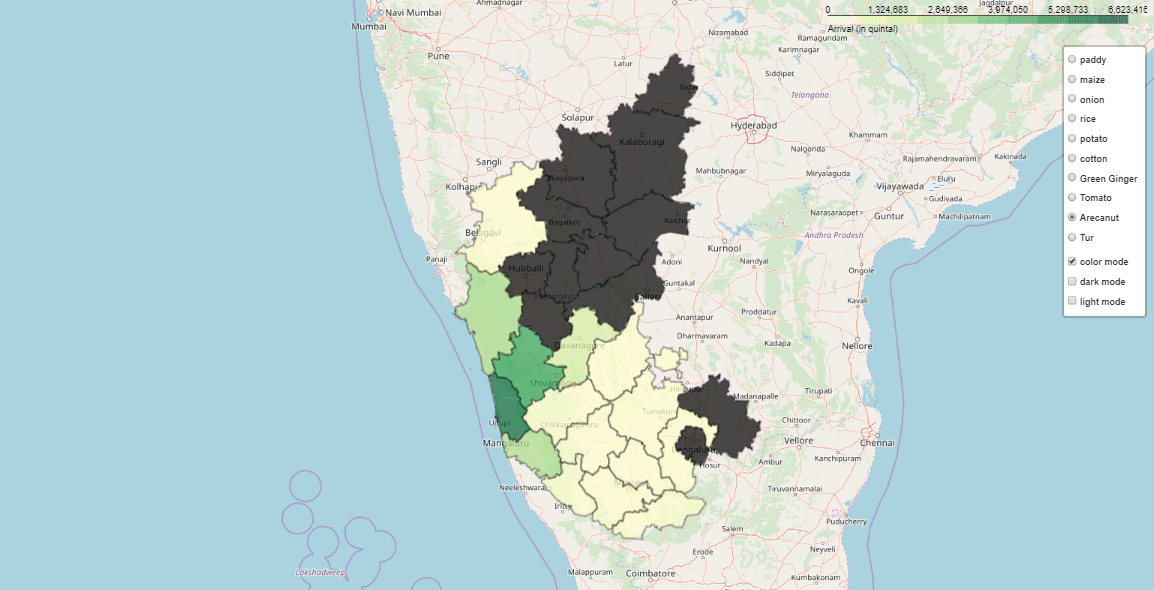 Fig 6: Arecanut across karnataka(click on the map for interaction)
Highest Commodity arrival Month and district wise:
If we segregate different months and look into the total arrival of commodities at different districts, we find these results:
- The arrival of Maize in Shimoga is the month of May is the highest, with 1763243 quintals.
- Onion in Bangalore urban in the month of October is the second highest.
- Paddy in Davanagere in month June is the third-highest
- Followed by onion in Bangalore urban in November, and arecanut in Udupi in the month of January.
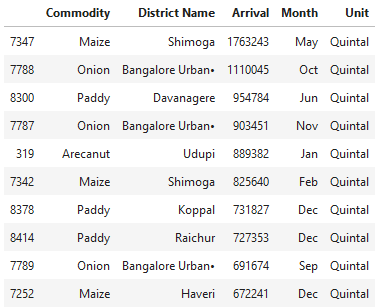 Fig.7 : Highest commodities month and district wise.
Disclaimer/limitations:
- Out of 156 Commodities in the data, we will only consider those which are in units of quintal, rest will be omitted for the sake of uniformity. The omitted commodities are - ‘Ash Gourd’, ‘Bull ‘, ‘Calf ‘, ‘Coconut ‘, ‘Cow ‘, ‘Goat ‘, ‘He Baffalo ‘, ‘Ox ‘, ‘Ram ‘, ‘She Baffalo ‘, ‘She Goat ‘, ‘Sheep ‘, ‘Tender Coconut’.
- The data was released in 2013 here. Refer Krishi Marata Vahini for the latest market data.
- In this analysis, we will not consider the national share. National share gives us an idea about how important the commodity is in the context of national production. Top commodities according to national share are - Mulberry, Coffee, Safflower, Ragi, Arecanut, Sunflower, Tamarind, Sericulture and Apiculture, Tamarind (En.wikipedia.org, 2020).
- The criteria used to measure the data is the arrival values (in quintal).
- Since the map is old, some of the new districts have not been represented. Districts such as Ramnagar,Chickballapur.
References:
- En.wikipedia.org. (2020). Economy of Karnataka. [online] Available at: https://en.wikipedia.org/wiki/Economy_of_Karnataka [Accessed 16 Jan. 2020].
- data.gov.in. (2013). Karnataka Agricultural Market Data for 2012. [online] Available at: https://data.gov.in/resources/karnataka-agricultural-market-data-2012 [Accessed 17 Jan. 2020].
Nagaraj Bhat
Master of data analytics
I build awesome ML products. Interests - Python, Machine learning, and poetry.