Australian bushfire - Map analysis
The Australian bushfire has led to a massive loss to wildlife, forest area and has even caused human casualties, including firefighters from the U.S. It has even affected the air quality in nearby cities such as Sydney and Melbourne. We will take a look at fire data obtained from NASA satellite's MODIS and VIIRS.
You can find my python code for this analysis here in kaggle
What is covered?
- Timeline of bushfire - barplot
- Dates on which bushfires were at a peak.
- Regions with Highest recorded fire radiation in a day
- A heat map with time - for Australian bushfire
- SE(South Eastern) region Fire
- Canberra Fire over the last 10 days
- Kangaroo island fire
Data :
The data was captured by two NASA satellite's MODIS and VIIRS. It was compiled and uploaded by me here.
The Satellites -
- In MODIS (Moderate Resolution Imaging Spectroradiometer) each hotspot detection represents the center of l km, meaning at least one fire is located in less than 1km region.
- Since VIIRS (Visible Infrared Imaging Radiometer Suite) provides more spatial resolution(375m), We will be using VIIRS for further visualization and analysis.
Time Period :
We will consider data for the last 3 months - Nov 1, 2019 to Jan 31, 2020.
Measurement -
The main field used for measurement is FRP. It depicts the pixel-integrated FRP (FIre Radiation Power) in MW (Megawatts).
Timeline of the bushfire
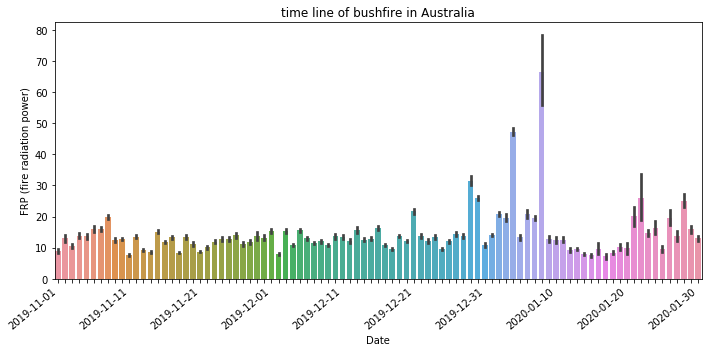 fig.1 : Timeline of the bushfire
- The above barplot represents the progress of fire from Nov 1, 2019 to jan 31, 2020
- You can notice three big spikes after 30th Dec, representing highest frp activity
Dates on which bushfire was at peak -
- 4th Jan, 2020 with total recorded FRP all around Australia found to be 1653384.1 MW.
- 30th Dec, 2019 with total FRP of 883598.6 MW.
- 8th Jan, 2020 with total FRP of 542117.9 MW.
- 29th Dec,2019.
- 2nd Jan,2020.
Highest affected regions in a Single Day
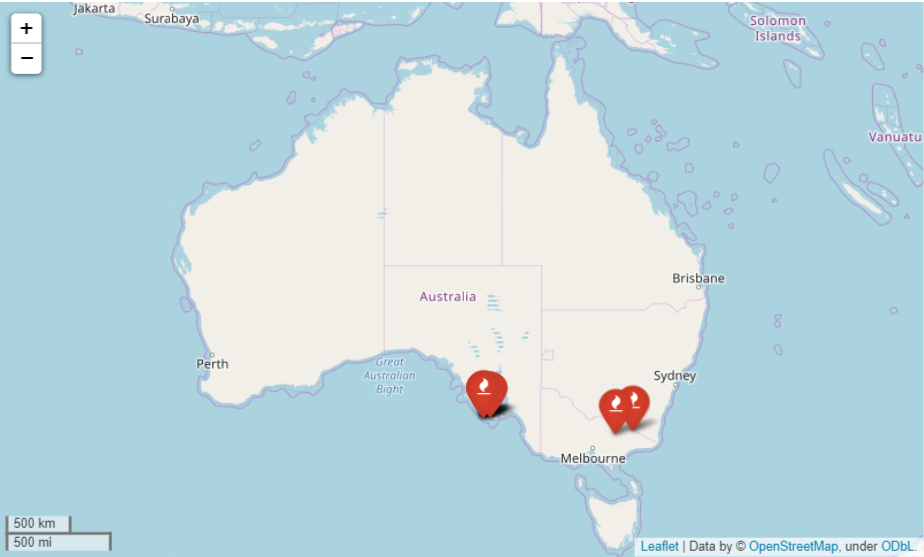 fig.2: Highest affected regions in a single day (Click on the map for interaction)
- Abbeyard, Victoria on 8th Jan - with FRP of 10717.2 MW.
- Flinders chase in Kangaroo island on 8th Jan - with FRP of 5611.8 MW
- Ravine road, flinders chase in Kangaroo Island - with FRP of 4948.8 MW.
- Cobberas, Victoria on 4th Jan
- West bay road, Flinders chase in kangaroo island on 8th Jan
Australian bushfire Map
 fig.3: Australian bushfire map (Click on the map for interaction - timeline reduced due to large file size)
- The above map gives heatmap with time
- Click on it and play it at higher fps to increase speed
- Fire activity is calculated using FRP(fire radiation power)
South Eastern (SE) region Fire
South Eastern region was the most affected in the recent Bushfire. The following map depicts the spread of fire.
 fig.4: South Eastern bushfire map (Click on the map for interaction- timeline reduced due to large file size)
Fire near Canberra from Jan 20th to Jan 30th
You can see the red spot appearing in Canberra after 25th, indicating fire activity
 fig.5: Fire near Canberra region from 20th to 30th Jan,2020 (Click on the map for interaction)
Kangaroo Island Fire
- Wait for a while to observe the fire activity.
- Observe the peak of fire activity on kangaroo island from 20th December to 10th January
 fig.6: Kangaroo Island bushfire map (Click on the map for interaction- timeline reduced due to large file size)
Conclusion:
Dates on which Bushfires were at a peak in Australia were - 4th Jan, 30th Dec, 8th Jan.
In fact, The fire radiation power all over Australia on 4th Jan was double the second-highest recorded.
Regions with highest recorded fire radiation power in a day were: Abbeyard - Victoria, West Bay Road, and Ravine Road - flinders chase in Kangaroo island, all on 8th Jan.
Most of the fire activity in kangaroo island falls between 20th December to 10th January, and in Canberra, it has been observed from 25th January onwards.
Nagaraj Bhat
Master of data analytics
I build awesome ML products. Interests - Python, Machine learning, and poetry.